Trading With The Ichimoku Cloud Indicator: A Comprehensive Guide
In the world of technical analysis, the Ichimoku Cloud stands out as a multifaceted tool that offers traders a comprehensive view of market trends, momentum, and potential support and resistance levels.
Developed by Japanese journalist Goichi Hosoda in the late 1930s and made public in the 1960s, the Ichimoku Cloud, or Ichimoku Kinko Hyo, translates to “one glance equilibrium chart.”
This name reflects its purpose: to provide a holistic snapshot of an asset’s price action in a single glance.
Unlike traditional indicators that focus on price alone, the Ichimoku Cloud incorporates multiple elements to offer a broader perspective. It consists of five key components:
- Tenkan-sen (Conversion Line): The average of the highest high and the lowest low over the past 9 periods.
- Kijun-sen (Base Line): The average of the highest high and the lowest low over the past 26 periods.
- Senkou Span A (Leading Span A): The average of the Tenkan-sen and Kijun-sen, plotted 26 periods ahead.
- Senkou Span B (Leading Span B): The average of the highest high and the lowest low over the past 52 periods, plotted 26 periods ahead.
- Chikou Span (Lagging Span): The current closing price, plotted 26 periods behind.
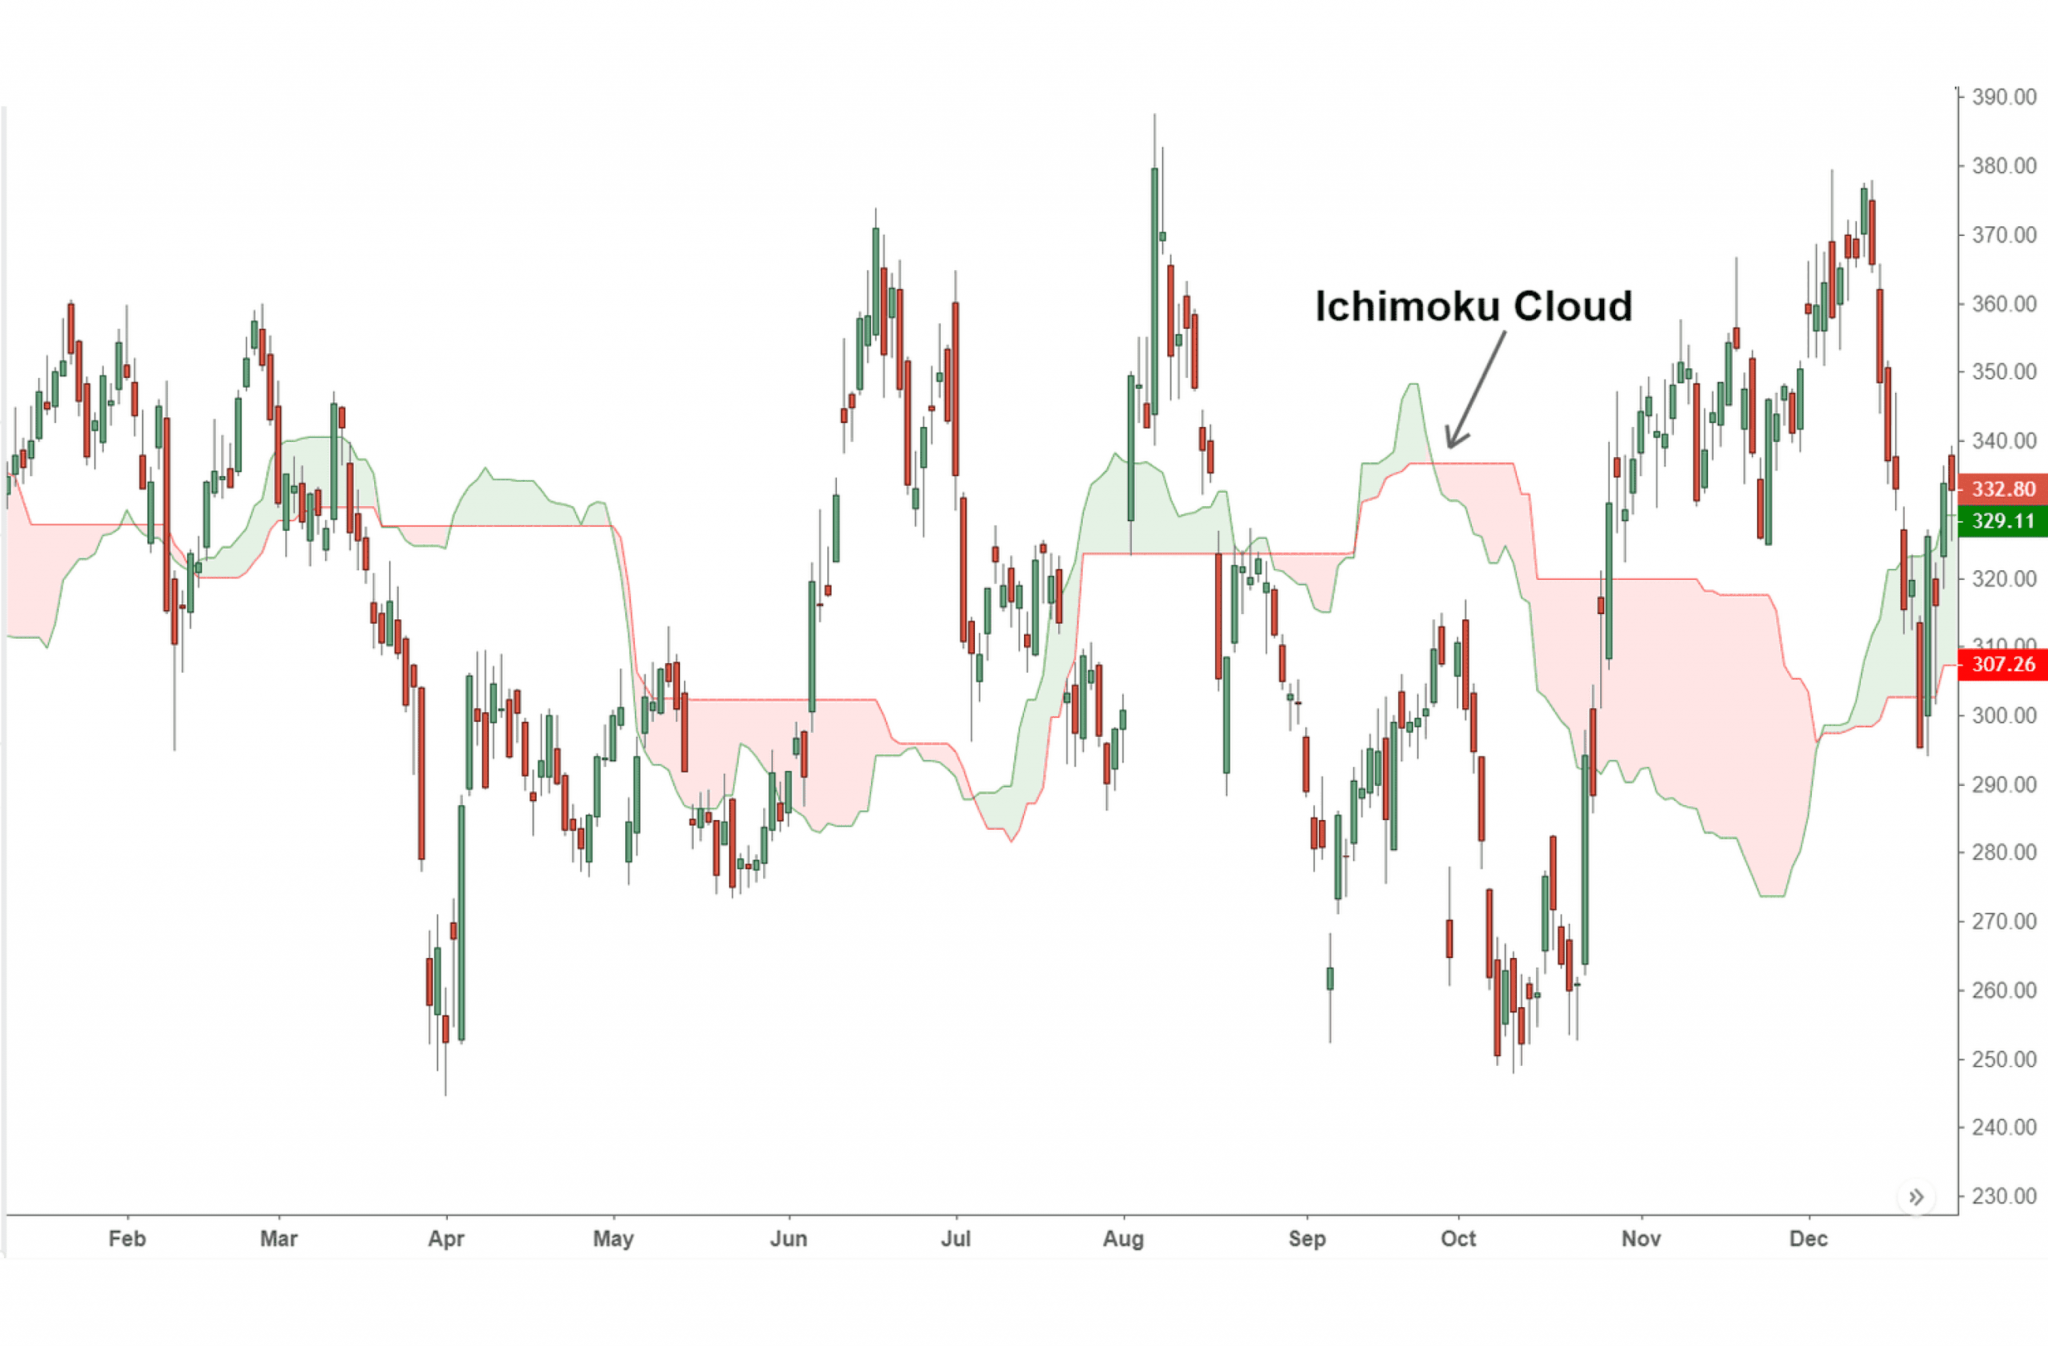
The area between Senkou Span A and Senkou Span B forms the “cloud” (Kumo), which provides insight into potential support and resistance levels.
Understanding the Components
Tenkan-sen (Conversion Line)
The Tenkan-sen is a short-term indicator that reacts quickly to price changes. It is calculated by averaging the highest high and the lowest low over the past 9 periods.
Traders often use crossovers between the Tenkan-sen and Kijun-sen to identify potential buy or sell signals.
Kijun-sen (Base Line)
The Kijun-sen serves as a longer-term indicator, calculated by averaging the highest high and the lowest low over the past 26 periods. It provides insight into the overall trend direction. When the price is above the Kijun-sen, the trend is considered bullish; when below, bearish.
Senkou Span A & B (Leading Spans)
Senkou Span A is the average of the Tenkan-sen and Kijun-sen, plotted 26 periods ahead, while Senkou Span B is the average of the highest high and the lowest low over the past 52 periods, also plotted 26 periods ahead.
The space between these two lines forms the cloud, which acts as dynamic support and resistance levels.
Chikou Span (Lagging Span)
The Chikou Span is the current closing price plotted 26 periods behind. It provides insight into the relationship between the current price and past price action.
If the Chikou Span is above the price 26 periods ago, it indicates a bullish trend; if below, a bearish trend.
Interpreting the Cloud
The cloud’s color and position relative to the price chart offer valuable information:
- Bullish Signal: When the price is above the cloud, and the cloud is green (Senkou Span A is above Senkou Span B), it indicates a strong uptrend.
- Bearish Signal: When the price is below the cloud, and the cloud is red (Senkou Span A is below Senkou Span B), it indicates a strong downtrend.
- Neutral Market: When the price is within the cloud, it suggests a consolidation phase or indecision in the market.
Trading Strategies with Ichimoku Cloud
Trend Following
One of the primary uses of the Ichimoku Cloud is to identify and follow trends:
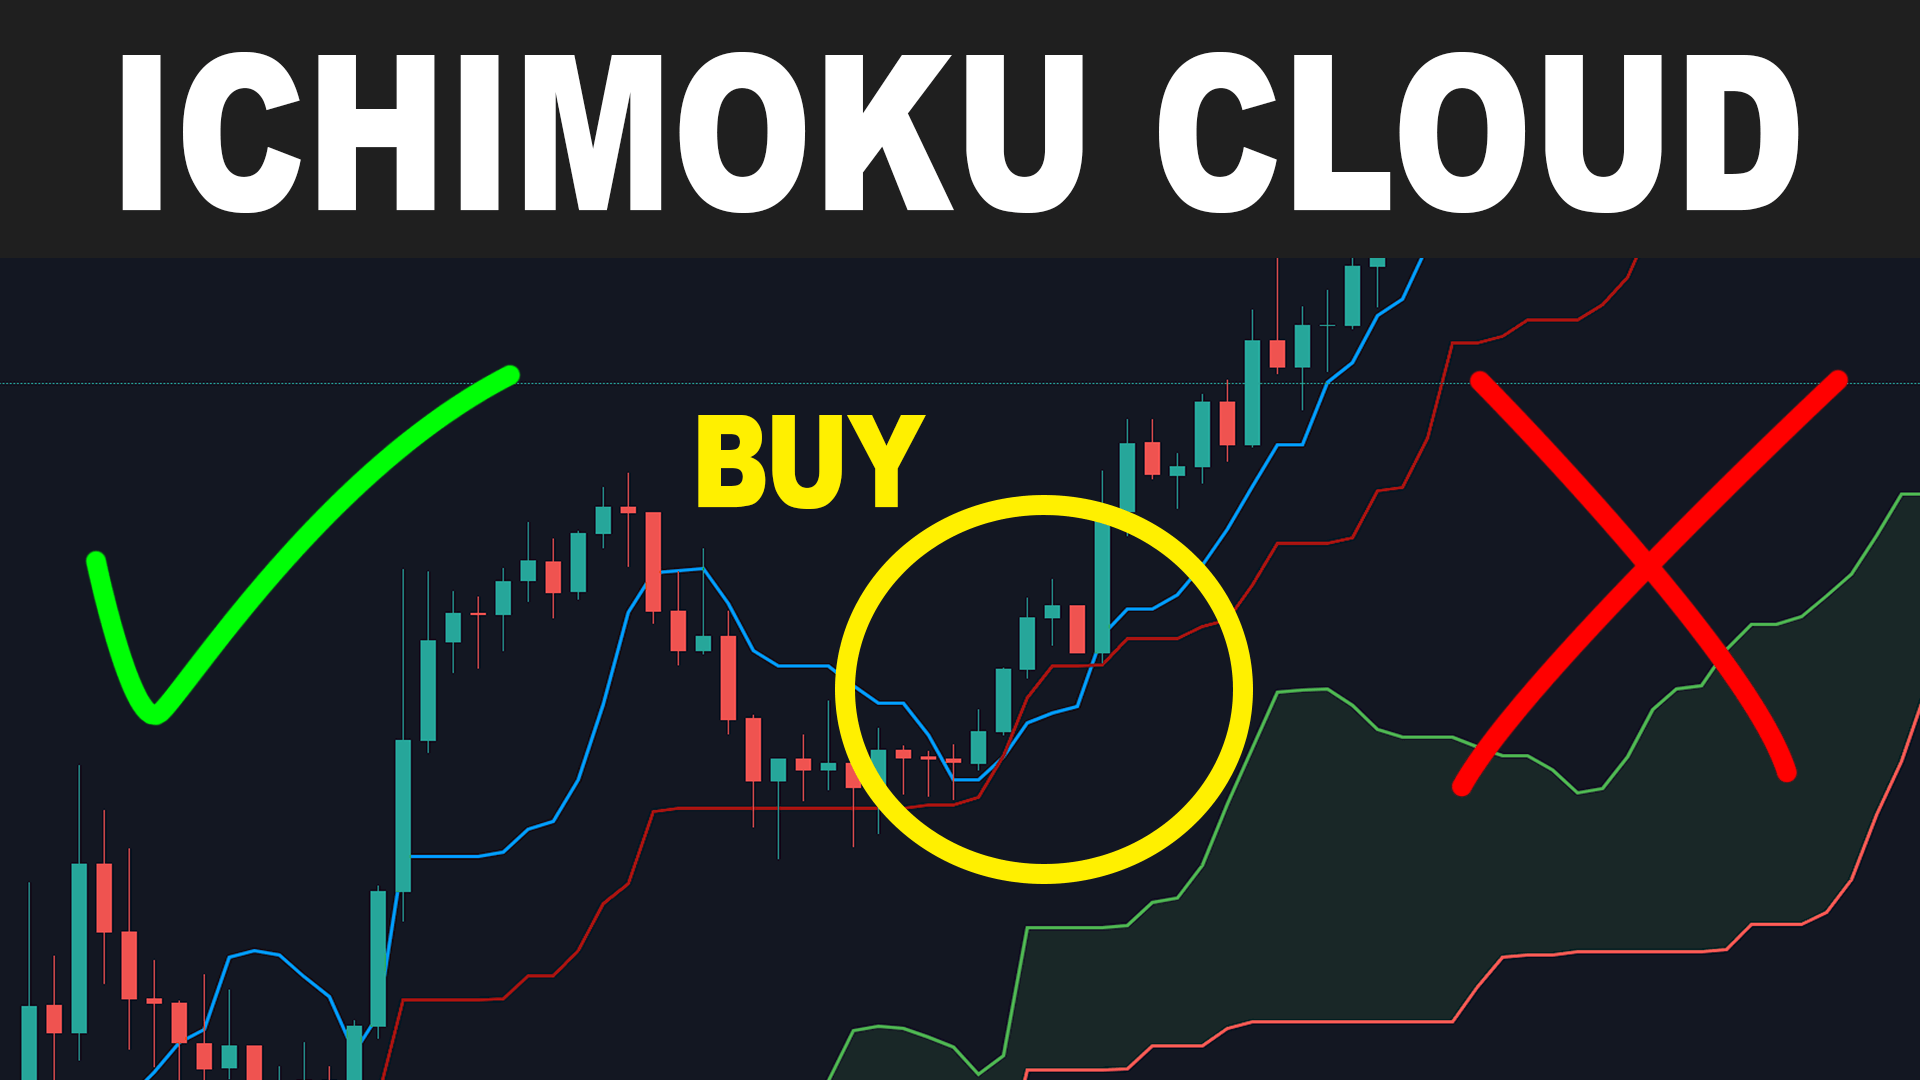
- Buy Signal: Enter a long position when the price is above the cloud, and the Tenkan-sen crosses above the Kijun-sen.
- Sell Signal: Enter a short position when the price is below the cloud, and the Tenkan-sen crosses below the Kijun-sen.
Support and Resistance Levels
The cloud itself acts as dynamic support and resistance:
- Support: In a bullish trend, the cloud can act as a support level. If the price pulls back to the cloud and holds, it may present a buying opportunity.
- Resistance: In a bearish trend, the cloud can act as a resistance level. If the price rallies to the cloud and fails to break through, it may present a selling opportunity.
Chikou Span Confirmation
The Chikou Span can be used to confirm trade signals:
- Buy Confirmation: If the Chikou Span is above the price 26 periods ago, it confirms a bullish trend.
- Sell Confirmation: If the Chikou Span is below the price 26 periods ago, it confirms a bearish trend.
Advantages and Limitations
Advantages
- Comprehensive View: Provides a holistic view of the market with multiple indicators in one chart.
- Dynamic Support and Resistance: The cloud offers dynamic support and resistance levels that adjust with price action.
- Trend Confirmation: Helps confirm trends and potential reversals, reducing the risk of false signals.
Limitations
- Complexity: The multiple components can be overwhelming for beginners.
- Lagging Indicator: Some components, like the Chikou Span, are lagging indicators and may not provide timely signals.
- Sideways Markets: The Ichimoku Cloud may produce false signals in choppy or sideways markets.
Case Study: USD/JPY Trade
Consider a scenario where the USD/JPY currency pair is trading above the cloud, indicating a bullish trend. The Tenkan-sen crosses above the Kijun-sen, providing a buy signal.
The Chikou Span is also above the price 26 periods ago, confirming the bullish trend. A trader could enter a long position with a stop loss below the cloud and a target at the next resistance level.
Conclusion
The Ichimoku Cloud is a powerful tool for traders seeking to understand market trends, momentum, and potential support and resistance levels.
By incorporating its components into a comprehensive trading strategy, traders can make informed decisions and improve their trading outcomes.
However, like all technical indicators, it is essential to use the Ichimoku Cloud in conjunction with other tools and analysis methods to enhance its effectiveness.
FAQ
What is the Ichimoku Cloud?
The Ichimoku Cloud is a technical analysis indicator that provides a comprehensive view of market trends, momentum, and potential support and resistance levels. Investopedia
How do I use the Ichimoku Cloud in trading?
Traders use the Ichimoku Cloud to identify trends, confirm signals, and determine potential entry and exit points by analyzing the position of the price relative to the cloud and the crossovers of the Tenkan-sen and Kijun-sen. ChartSchool
What do the colors of the cloud represent?
The cloud’s color indicates the trend direction: green when the price is above the cloud and the cloud is bullish, and red when the price is below the cloud and the cloud is bearish. IG
Can the Ichimoku Cloud be used in all markets?
Yes, the Ichimoku Cloud can be applied to various markets, including forex, stocks, and commodities. Corporate Finance Institute
What is the Chikou Span?
The Chikou Span is the current closing price plotted 26 periods behind, providing insight into the relationship between the current price and past price action. Investopedia
How do I set stop losses using the Ichimoku Cloud?
Traders often place stop losses below the cloud in a bullish trend or above the cloud in a bearish trend to protect against adverse price movements.
Is the Ichimoku Cloud suitable for all timeframes?
While the Ichimoku Cloud can be used across various timeframes, it is particularly effective in longer timeframes where trends are more established. ChartSchool
How can I combine the Ichimoku Cloud with other indicators?
Traders often combine the Ichimoku Cloud with other indicators, such as the Relative Strength Index (RSI) or Moving Average Convergence Divergence (MACD), to confirm signals and enhance decision-making. IG
Are there automated tools for trading with the Ichimoku Cloud?
Yes, platforms like Quantum AI offer automated trading tools that incorporate the Ichimoku Cloud strategy, allowing traders to execute trades based on predefined criteria. 3Commas
How can I learn more about trading with the Ichimoku Cloud?
There are numerous resources available, including books, online courses, and trading communities, where traders can learn more about the Ichimoku Cloud and its applications in trading. Amazon
For more information on trading strategies and tools, you can visit Quantum AI

Jim’s passion for Apple products ignited in 2007 when Steve Jobs introduced the first iPhone. This was a canon event in his life. Noticing a lack of iPad-focused content that is easy to understand even for “tech-noob”, he decided to create Tabletmonkeys in 2011.
Jim continues to share his expertise and passion for tablets, helping his audience as much as he can with his motto “One Swipe at a Time!”